When we say “open source patient monitor,” we mean something specific: a vital signs monitoring system where the complete hardware design — schematics, PCB layout, bill of materials — is published under an open licence, and the firmware source code is freely available for anyone to study, modify, and redistribute.
This isn’t a metaphor. It means you can download the KiCad files, inspect every trace on the PCB, understand exactly how the analog front-end amplifies a microvolt-level cardiac signal, and modify it for your own application. No NDAs, no locked-down firmware binaries, no proprietary data formats.
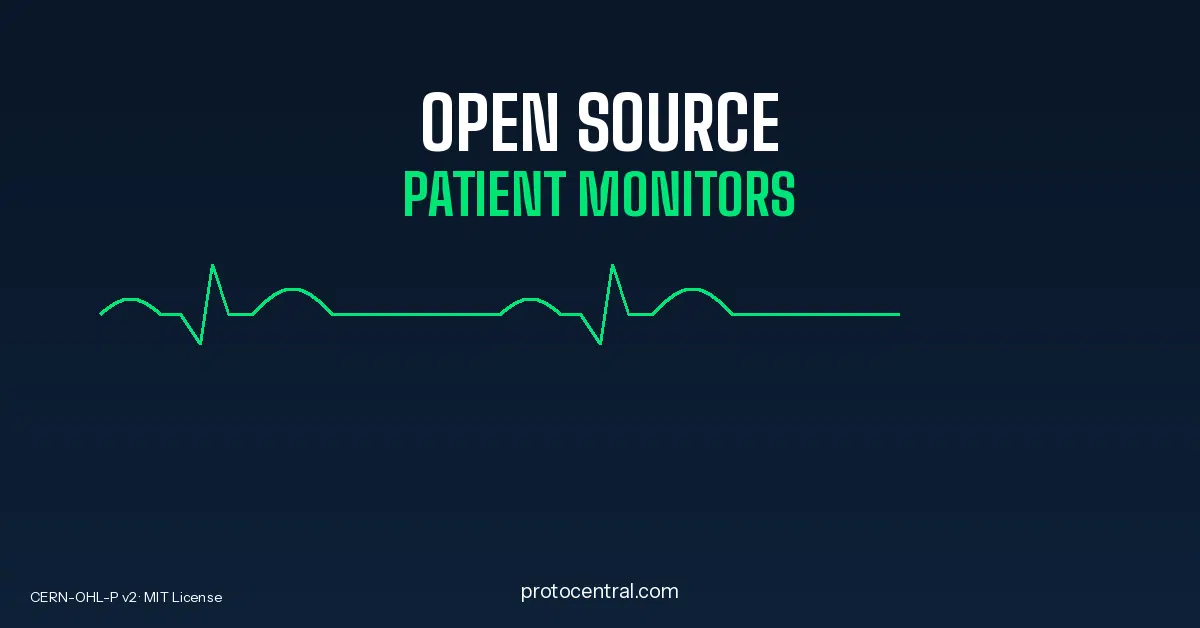
At ProtoCentral, every board we ship is released under CERN-OHL-P v2 (the permissive variant of the CERN Open Hardware Licence) and the firmware under MIT. This is the same licence framework used by CERN for particle physics instrumentation — it was designed specifically for hardware that needs to be trustworthy, inspectable, and modifiable.
Why Open Source Matters for Medical Instrumentation
Commercial patient monitors from companies like Philips, GE, and Mindray are excellent clinical tools. They’re FDA-cleared, CE-marked, and built for 24/7 hospital operation. But they share a common characteristic: the designs are proprietary. You can’t see how the ECG front-end works. You can’t modify the SpO2 algorithm. You can’t export raw data in an open format for custom analysis.
For three groups of users, this is a real problem:
Researchers need to understand exactly what their instruments are doing. When you’re publishing a paper on a novel HRV analysis algorithm, your reviewers will ask about signal quality, filtering, and sampling methodology. With a closed-source monitor, you can only quote the manufacturer’s spec sheet. With open source hardware, you can point to the actual circuit design, the ADC configuration registers, and the digital filter coefficients. Your methodology is fully reproducible.
Educators need students to learn from the inside out. A biomedical engineering student who connects electrodes to a sealed box and reads numbers on a screen hasn’t learned instrumentation — they’ve learned to operate an appliance. With an open source monitor, students can trace the signal path from electrode through instrumentation amplifier through ADC through digital filter to display. That’s the difference between training a technician and educating an engineer.
Developers building digital health products need a reference platform they can actually learn from. If you’re designing a wearable ECG patch, you need to understand how right-leg drive works, how lead-off detection affects signal quality, and how to configure the ADS1292R’s internal oscillator for impedance pneumography. An open source reference design gives you all of this — not as application notes, but as a working, tested implementation you can run on your bench.
What Signals Can You Actually Acquire?
A “patient monitor” in the clinical sense tracks five core vital signs: ECG (heart electrical activity), SpO2 (blood oxygen saturation), respiration rate, body temperature, and blood pressure. Open source platforms currently handle four of these well. Non-invasive blood pressure (NIBP) remains difficult due to the complexity of oscillometric cuff algorithms and the calibration requirements — it’s an area where commercial devices still have a clear advantage.
Here’s what’s achievable today with ProtoCentral hardware:
Electrocardiogram (ECG): Using the Texas Instruments ADS1292R — a 2-channel, 24-bit analog front-end — you get diagnostic-quality ECG with >105 dB common-mode rejection ratio (CMRR) and <8 µVpp input-referred noise. That's sufficient to resolve P-QRS-T morphology clearly enough for heart rate variability (HRV) analysis, R-peak detection, and even basic arrhythmia screening in research contexts. The ADS1292R also provides built-in impedance pneumography on its second channel, giving you respiration rate measurement from the same chip. Pulse Oximetry (SpO2): The MAX30102 is a dual-wavelength (red + infrared) reflective photoplethysmography sensor with an 18-bit ADC and built-in ambient light cancellation. With proper calibration against a reference oximeter, it achieves SpO2 accuracy within ±2% in the 90–100% range. The raw PPG waveform also gives you pulse rate, perfusion index, and pulse transit time.
Body Temperature: The MAX30205 provides ±0.1°C accuracy in a tiny I2C package. Clinical-grade digital thermometry.
Respiration: Derived from the ADS1292R’s impedance pneumography channel (thoracic impedance changes during breathing) or from external piezo/RIP belts. Respiratory rate accuracy within ±2 breaths per minute.
Building Your First Open Source Vital Signs Monitor
The fastest path from zero to real biosignals on your screen is ProtoCentral’s HealthyPi 5. It combines the RP2040 microcontroller (the same chip in the Raspberry Pi Pico) with an ESP32-C3 for wireless connectivity, and integrates ECG, SpO2, respiration, and temperature acquisition on a single board.
Here’s what the setup looks like:
What You Need
- HealthyPi 5 board ($275)
- 3-lead ECG cable with disposable Ag/AgCl electrodes
- SpO2 finger clip sensor
- USB-C cable
- A laptop with Arduino IDE or Python installed
Step 1: Connect and Power Up
Connect HealthyPi 5 to your laptop via USB-C. The board is powered from USB and immediately begins acquiring data from all connected sensors. No driver installation needed on most systems — the RP2040 enumerates as a standard USB serial device.
Step 2: See Your ECG
Open Arduino IDE’s Serial Plotter (Tools → Serial Plotter) at 115200 baud. Place the three ECG electrodes: right arm (RA), left arm (LA), and right leg (RL — this is the reference/ground electrode, not actually measuring the leg). You should see your ECG waveform with clear P-QRS-T morphology within seconds.
What you’re seeing is the electrical activity of your heart, amplified by the ADS1292R’s instrumentation amplifier (programmable gain up to 12×), digitized at 24-bit resolution and 500 samples per second, and streamed to your laptop. The entire signal chain — from electrode to screen — is documented in the HealthyPi 5 GitHub repository.
Step 3: Add SpO2
Clip the SpO2 finger sensor onto your index finger. The MAX30102 alternates red (660nm) and infrared (880nm) LED pulses, measures the transmitted/reflected light, and the firmware calculates the red/IR ratio that maps to oxygen saturation via the Beer-Lambert law. You’ll see both the raw PPG waveform (the pulsatile blood volume signal) and the calculated SpO2 percentage.
Step 4: Stream Over BLE
HealthyPi 5’s ESP32-C3 module can stream all sensor data over Bluetooth Low Energy. Install the OpenView2 app on your Android phone, and you have a wireless vital signs display — ECG waveform, heart rate, SpO2, respiration rate, and temperature, all in real time.
Step 5: Log and Analyse
For research applications, you’ll want to log data to an SD card for offline analysis. HealthyPi supports CSV and EDF+ (the European Data Format, which is the standard for physiological recordings). EDF+ files can be directly imported into Python analysis tools like MNE-Python, YASA (for sleep staging), or any standard biosignal analysis toolkit.
What About HealthyPi 6?
HealthyPi 6 is our latest platform, currently funded on Crowd Supply and shipping in May 2026. It’s a significant step up: an STM32H757 dual-core processor (Cortex-M7 + Cortex-M4), ESP32-C6 with Wi-Fi 6, a 4-inch capacitive touchscreen, 3-channel ECG (for full 12-lead reconstruction), and an expansion system called HealthyLink for connecting additional sensor modules. At $599, it’s designed for standalone bedside monitoring and edge AI applications — the kind of use cases where you need on-device processing power and a built-in display.
If you’re just getting started or need an affordable platform for education or portable research, HealthyPi 5 at $275 is the better entry point. We’re also working on HealthyPi Go — a $199 headless (no display) platform designed specifically as a portable, battery-powered sensor hub for researchers and educators. More on that soon.
Using Open Source Hardware in Your Application
Whether you’re equipping a university teaching lab, building a reference platform for your digital health startup, or running a multi-site sleep research study, open source hardware gives you something no commercial monitor can: complete transparency and unlimited modifiability.
Every ProtoCentral design — schematics, PCB layouts, firmware, and documentation — is available on our GitHub. The hardware licence (CERN-OHL-P v2) explicitly permits commercial use, modification, and redistribution. Researchers and developers around the world have used ProtoCentral hardware in published studies, student projects, and commercial prototypes — and several have contributed firmware improvements and analysis tools back to the repositories. If you use our hardware in published research, we’d appreciate a citation — but it’s not required.
If you’re evaluating platforms for a teaching lab or research project, we’re happy to discuss options and can provide formal quotes for purchase order processing — reach out at research-support@protocentral.com.
All ProtoCentral products are for research and education use only — not medical devices. Not FDA cleared or CE marked as medical devices.